Every commercial grower faces the same pressure: cut costs, but don’t touch the yield. The good news is that these two goals aren’t as opposed as they seem. When you understand what’s actually driving your energy bill and what’s driving your plants’ output, you can do both at once.
This isn’t a guide about trimming corners. It’s a guide about working smarter with light, the single most controllable and impactful input in any indoor grow operation. Whether you’re running a cannabis facility, a vertical leafy greens operation, or a propagation greenhouse, the same principles apply.
Start With What You’re Actually Measuring
Most efficiency losses happen silently. Growers know their electric bill, but few know their grams per watt, their DLI uniformity across the canopy, or their photon cost per kilogram of harvest. Without those numbers, optimization is guesswork.
Before you change anything, establish your baseline metrics:
Daily Light Integral (DLI): Total moles of photons delivered per square meter per day. Most fruiting crops need 30–45 mol/m²/day; leafy greens peak at 12–22. Are you consistently hitting target across your canopy, or wasting photons on hotspots while the edges starve?
Photosynthetic Photon Efficacy (PPE): Measured in µmol/J, this is the true efficiency number for LEDs. Top-tier commercial fixtures now reach 3.0 µmol/J. If yours are below 2.0, you’re leaving real money on the table.
Canopy uniformity ratio: Divide minimum PPFD by average PPFD across your canopy. A ratio below 0.7 means uneven growth, inconsistent quality, and wasted light.
Kilowatt-hours per gram or per pound: Your single most honest efficiency metric. Track it weekly, not just at harvest.
Once you have these numbers, you have a real map of where efficiency is leaking, and that changes everything about where you invest next.
If you’ve ever asked, “Is my PPFD too high?” or “How much DLI do my plants actually need?” you’re not alone. Read our blog, PPFD vs DLI Explained: The Grower’s Lighting Cheat Sheet.
The Spectrum Question Most Growers Get Wrong
There’s a persistent belief in the industry that “more blue = more vegetative growth” and “more red = more flowering.” That’s partially true, but dangerously oversimplified. What actually matters is how your plants are interpreting the full spectrum throughout their lifecycle, and whether your light source is optimized for photosynthesis, morphology, or both.
Blue light is a regulator, not just an engine. Blue wavelengths (400–500nm) govern stomatal opening, stem elongation, and secondary metabolite production. In cannabis, a higher blue ratio during late vegetative and early flower can improve structure and terpene expression. But too much blue drives excessive heat stress response and slows growth rate. The ratio matters more than the absolute amount.
Green light penetrates deeper than you think. Green wavelengths (500–600nm), long dismissed as “reflected by plants,” are actually absorbed effectively by chlorophyll in lower canopy layers. In dense canopies, a full-spectrum source with a meaningful green component will outperform narrow red-blue designs, both in uniformity and overall productivity.
Lighting Schedules: The Free Efficiency Gain Nobody Takes Seriously
Photoperiod management is one of the most underutilized tools in commercial horticulture. Most operations run a fixed schedule and move on. But sophisticated growers are extracting serious efficiency gains through dynamic photoperiod control, adjusting light hours and intensity in response to actual plant demand and environmental conditions.
Cyclic lighting (intermittent lighting). Research has shown that plants don’t necessarily need continuous light to achieve maximum photosynthesis. Short off-cycles (2–4 minutes every 20–30 minutes) allow stomata to remain open and carbon fixation to continue even after light intensity is briefly reduced. For certain crops, this can reduce energy consumption by 15–25% with no yield loss, because plants are processing photons, not just receiving them.
Sunrise/sunset ramping. Abrupt on/off transitions stress plants, not dramatically, but measurably. Ramping intensity over 15–30 minutes at the start and end of the photoperiod improves stomatal regulation, reduces humidity spikes (easing your HVAC load), and aligns with natural circadian rhythms your crops developed. It’s a small change with compounding benefits over time.
Key insight: HVAC and lighting are not separate systems; they’re deeply interdependent. Every watt of light that doesn’t become photosynthesis becomes heat. Improving lighting efficiency is one of the most reliable ways to reduce cooling load, and a properly staged photoperiod schedule can reduce peak HVAC demand by 10–20%.
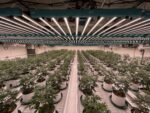
Fixture Placement and Canopy Architecture: Where Most Operations Waste 20% of Their Light
Even the best fixture performs poorly if it’s in the wrong position. Light intensity follows the inverse-square law, double the distance between fixture and canopy, and you lose roughly 75% of your PPFD. Most growers know this in theory, but few audit their actual mounting heights regularly as canopy height changes through the grow cycle.
Uniformity over intensity. A canopy with 900 µmol/m²/s uniform PPFD will reliably outperform a canopy with a 1,200 µmol/m²/s average but 40% uniformity variation. Hotspot plants hit the light saturation point and stop converting photons efficiently. The edges are photon-starved. Your harvest is averaged down by both extremes.
The fix is usually a combination of fixture overlap design, reflective wall treatment, and canopy training, not simply buying more lights.
Vertical farming and under-canopy lighting. For dense vertical systems or large-format cannabis grows, positioning supplemental LED strips under the canopy rather than only above it can dramatically increase DLI in lower leaf zones without increasing overhead wattage. Studies consistently show 15–30% biomass increases from under-canopy light supplementation in high-density growing.
Reflective surfaces are underrated. Flat white paint reflects approximately 75–85% of light. Proper grow film reflects 90–95%. The difference in effective PPFD at canopy can be 8–12%, essentially free photons that require no additional energy input. In a 10,000 sq ft facility, that’s a meaningful yield improvement with a one-time materials investment.
LED Technology: Understanding What You’re Actually Buying
The LED grow light market is saturated with specifications that obscure more than they reveal. Here’s what to actually evaluate when assessing fixture efficiency:
PPE (µmol/J), not just total wattage. A 600W fixture at 3.2 µmol/J delivers more photons per dollar of electricity than an 800W fixture at 2.4 µmol/J. Always calculate the photon cost, not just the wattage.
L90 lifespan rating. This is the point at which the fixture delivers 90% of its original light output. L70 ratings (still common in marketing materials) significantly overstate usable fixture life. Ask for L90 data.
Thermal management. LEDs degrade faster and deliver fewer photons per watt as temperature increases. Fixtures with passive aluminum heatsinks in properly ventilated spaces often outperform actively cooled fixtures in real-world conditions. Ask for junction temperature data, not just ambient temperature specs.
Spectrum certification. Manufacturer-provided spectrum data should be third-party validated. IES LM-79 is the industry-standard test method. If a supplier can’t provide it, that’s a significant red flag.
Dimming range and control protocol. 0–10V dimming is standard, so don’t rely on fixtures utilizing a proprietary control protocol. Also, search for a true “dim-to-off,” as this is essential for granular control. This matters more as your facility scales.
Read our blog, The Real Cost of Cheap LEDs, to learn more about how the quality of lights can affect your energy bill.
The Environmental Interaction You Can’t Ignore
Light doesn’t operate in isolation, it’s in constant dialogue with CO₂ concentration, temperature, humidity, and VPD. Optimizing your lighting without addressing this interaction is like tuning a race engine and leaving the air intake blocked.
The most important relationship: at elevated CO₂ (800–1,200 ppm), the light saturation point for most crops increases significantly. Crops that would show photoinhibition at 900 µmol/m²/s in ambient CO₂ can efficiently process 1,400–1,600 µmol/m²/s when CO₂ is optimized. If you’re supplementing CO₂, you may be significantly under-lighting your canopy. If you’re not, you may be significantly over-lighting it.
VPD is the other major interaction. High PPFD drives transpiration; high transpiration at low VPD creates conditions for botrytis and mildew. High PPFD at high VPD stresses plants into stomatal closure, reducing CO₂ uptake regardless of light levels. Lighting schedules that allow VPD to stabilize before ramping to full intensity consistently outperform abrupt high-intensity schedules.
A Practical Efficiency Audit: Where to Start This Week
You don’t need a full facility overhaul to start improving efficiency. Here’s a prioritized sequence based on what consistently delivers the highest ROI:
- Measure your DLI and uniformity this week. A basic quantum meter and 15 minutes of measurement across your canopy will reveal more about your current efficiency than any supplier specification sheet.
- Audit your mounting heights. Are your fixtures at the same height they were when you commissioned the room? Even a 4-inch adjustment can shift PPFD by 15%.
- Review your photoperiod schedule. Add sunrise/sunset ramping if you haven’t already, most modern fixtures support it with a firmware update.
- Calculate your kWh per gram or per pound. If you don’t know this number, make it your priority before your next harvest.
- Map your HVAC timing against your photoperiod. Is your cooling system staging efficiently with your light schedule, or running full capacity during off-hours?
Efficiency isn’t a one-time project, it’s a practice. The operations that consistently outperform their peers aren’t necessarily running the newest or most expensive equipment. They’re the ones measuring relentlessly, adjusting systematically, and treating every grow cycle as a data point.
Want to make your lighting work for you rather than against you? Download our FREE ebook Grow Room Lighting Layout.
Ready to Build a Lighting Plan That Actually Improves Your Numbers?
The growers who consistently hit efficiency targets aren’t guessing—they’re working from a plan built around their specific operation. Our team at BIOS can audit your current setup, model your optimal DLI targets, and design a lighting strategy that reduces your energy spend without touching your yield.
Frequently Asked Questions
What is the most important metric for grow light efficiency? Photosynthetic Photon Efficacy (PPE), measured in µmol/J, is the most important single metric, it tells you how many usable photons a fixture delivers per joule of electricity consumed. However, PPE alone isn’t sufficient. You also need canopy uniformity (minimum/average PPFD ratio) and your actual kWh per gram or pound harvested, which accounts for real-world placement, environment, and crop performance.
Can switching to LEDs reduce yield? A poorly planned LED transition can temporarily reduce yield if fixtures are under-specced, incorrectly positioned, or if growers don’t account for reduced heat output (LEDs produce less infrared than HPS, which can affect ambient temperature and VPD). A well-planned transition with equivalent or higher DLI delivery at the canopy consistently maintains or improves yield while reducing energy consumption by 30–50%. The key is matching DLI targets, not wattage, when speccing new fixtures.
How often should I audit my grow light performance? A full PPFD mapping audit should be conducted at least every 6 months, or whenever you change canopy architecture, fixture height, or plant training methods. LEDs typically lose 1–3% of output per year, so regular audits help you catch gradual degradation before it affects yield. Between full audits, tracking kWh per gram each harvest cycle gives you an ongoing efficiency signal.
What PPFD levels should I target for cannabis vs. leafy greens? For cannabis, vegetative phase typically targets 400–600 µmol/m²/s, with flowering pushing to 800–1,200+ µmol/m²/s (the higher end requires CO₂ supplementation to avoid photoinhibition). Leafy greens are significantly more efficient at lower intensities: 150–350 µmol/m²/s is optimal for most lettuce varieties, with microgreens and basil on the higher end of that range. Exceeding the light saturation point for your crop is one of the most common and costly efficiency mistakes in the industry.
Does spectrum actually matter for yield, or is PPFD the only thing that counts? Both matter, but in different ways. PPFD determines the rate of photosynthesis, while spectrum composition influences plant morphology, development speed, and secondary metabolite production. A calibrated spectrum with appropriate red:far-red ratios can measurably accelerate flowering, improve structure, and increase terpene expression in cannabis, without any change in PPFD or energy input. Spectrum becomes increasingly important as operations scale and optimize beyond the basics.
How does lighting affect my HVAC costs? Every watt of electrical input to a grow light eventually becomes heat, either directly (infrared from HPS/CMH) or indirectly (heat from LED components and unconverted electricity). This means lighting and HVAC costs are directly linked. High-efficacy LEDs convert more electricity into useful photons, meaning less of your energy budget goes to cooling. A well-designed LED system paired with smart photoperiod scheduling can reduce peak cooling demand by 10–20%, which compounds into significant annual savings.
Is under-canopy lighting worth the investment? For dense canopy crops, particularly tall cannabis grows or tightly packed vertical vegetable systems, under-canopy supplemental lighting consistently shows positive ROI. Research reports 15–35% biomass increases from adding LED strip lighting under the canopy at relatively low wattage. Gains are particularly pronounced in lower-tier cannabis flower quality and in leafy greens where lower leaves would otherwise be light-limited.
How do I know if I need a lighting consultation vs. just new fixtures? If your primary challenge is aging, low-efficacy equipment, a straightforward fixture upgrade may be sufficient. But if you’re experiencing uneven growth, inconsistent quality across the canopy, unexplained energy cost increases, or yield that’s plateaued despite equipment upgrades, those are signals of a system-level issue that new fixtures alone won’t fix. A lighting plan that accounts for room geometry, canopy architecture, HVAC interaction, and control strategy will consistently outperform any single equipment decision made in isolation.